Your cart is currently empty!
The below graphs of Global Temperature is produced with NOAA station data and NOAA Software GHCNM-v3.3.0 running on our server. Land surface temperatures are available from the Global Historical Climate Network-Monthly (GHCN-M). This will be automatically updated the 9th of Each month. Available on the 10th of the month.
GHCNM (version 3): Dr. J. H. Lawrimore, M. J. Menne, B. E. Gleason, C. N. Williams, D. B. Wuertz, R. S. Vose, and J. Rennie (2011), An overview of the Global Historical Climatology Network monthly mean temperature data set, version 3, J. Geophys. Res., 116, D19121, doi:10.1029/2011JD016187.
The graphs below are created by our Unix admin with help from NOAA Dr. Jay Lawrimore. The first graph is all hemisphere stations and shows warming of about 1.1 C since 1975. The second graph is the 80 ° northern hemisphere and shows 9.9 degrees warming since 1975 The third is the northern hemisphere stations and shows about a 1.1 C increase since 1975. The fourth is the southern hemisphere stations and shows about a 0.8 C increase since 1980. The fourth graph is -50 degrees below the equator to the south pole. This shows no warming. Therefore, the Antarctic glaciers not receding like the arctic ones.
Greenhouse gases like all gases diffuse until they are equal distant apart so they can’t cause this type of warming. Any freshman college chemistry student knows this. Also these and all gases get distributed throughout the earth by winds. I hope to work with Oregon State University Chemical, Biological and Environmental Engineering Professor of Transport II HEAT CHE 332 soon to determine how much of this heat is caused by GHG.
It’s no wonder a large percentage of scientists on the climate deniers list online are Astrophysics Ph D’s.
The shift of the earths tilt in the year 2000-2004 has the following effect of temperature rise by latitude. You can see this effect in individual graphs on the Graphs page. This shift is described by NASA JPL scientists as massive.
80° North effect is 4.6 C
70° North effect is 3.7 C
60° and 50° North show a lessor effect.
The first astrophysical event was in 1975. This effect is 1.0 C rise at the north pole.
You can see all the NOAA Graphs here. NOAA Data Station Graphs by Latitude
You can get these graphs direct from NOAA here:
- NOAA National Centers for Environmental information, Climate at a Glance: Global Time Series, published March 2018, retrieved on April 7, 2018 from http://www.ncdc.noaa.gov/cag/ However you can’t choose all longitudes currently. You can see the mapping has warming in the north and cooling in the south.

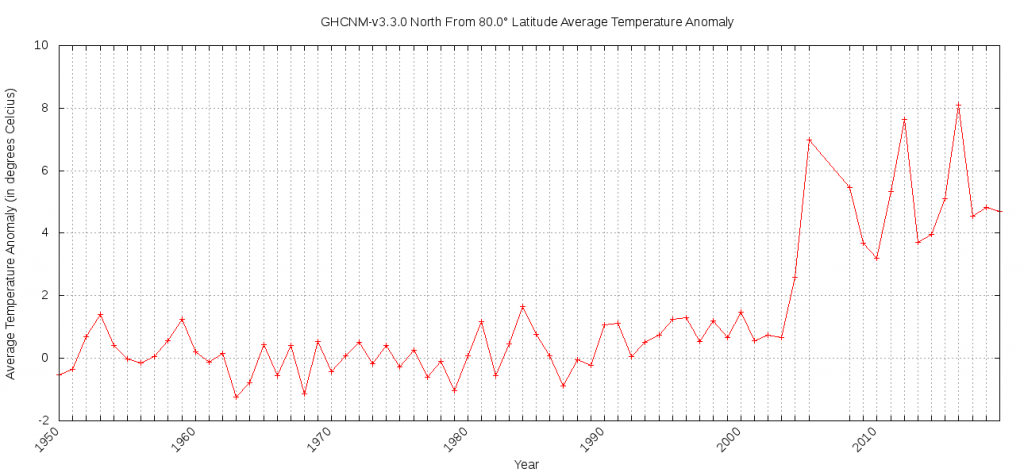
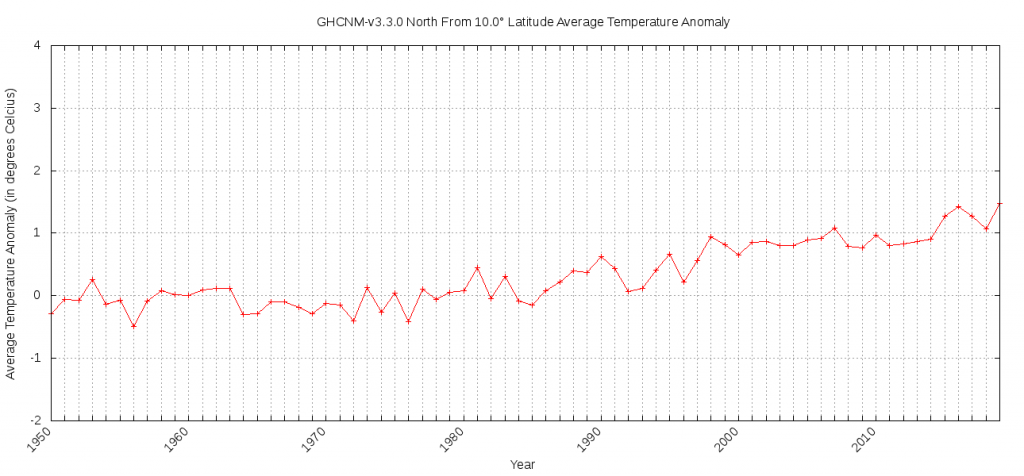
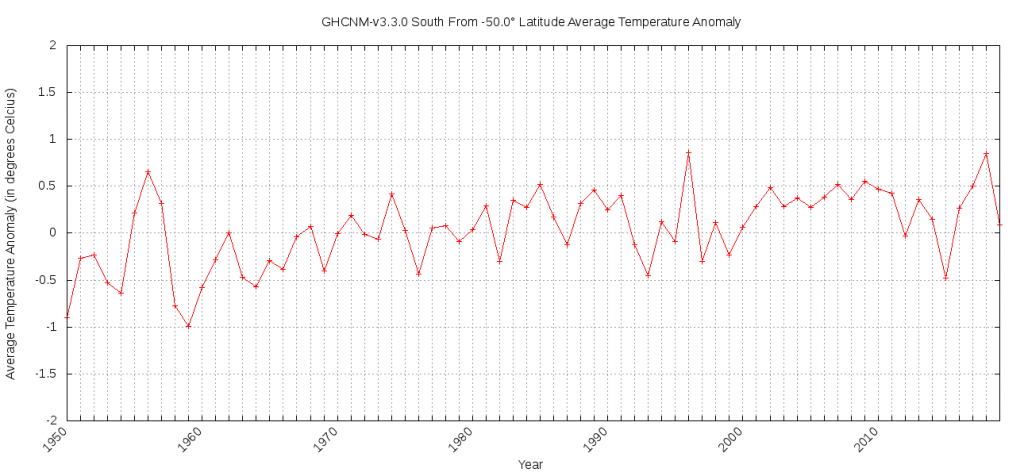
The script we made to create the graphs has been confirmed by NOAA Dr J. H. Lawrimore to be correct. The link below will allow anyone with access to a Unix server and create these graphs.
Graph Script
The graph below is NOAA data station temperature change by latitude with March 2019 data and before.
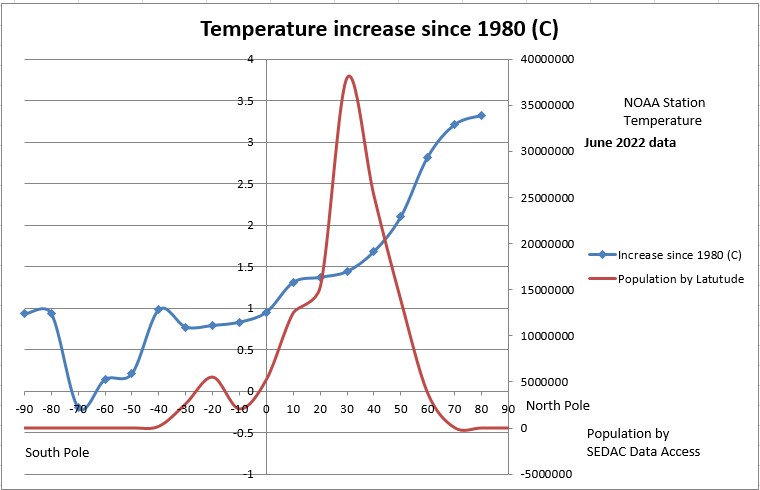
Minimum temperature increase is -0.05 C. max is 3.45 C
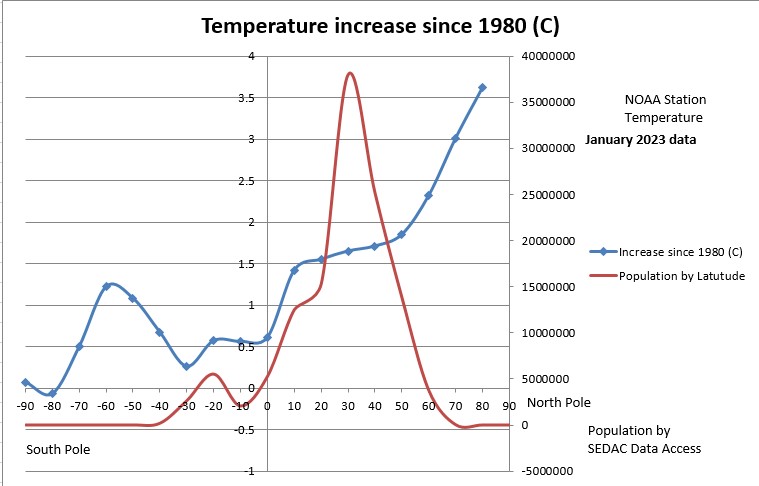
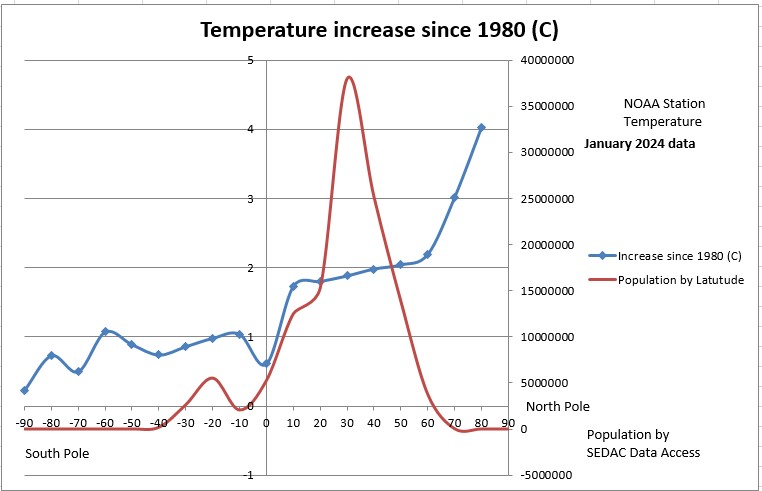
Minimum temperature increase is -0.07 C. max is 3.63 C
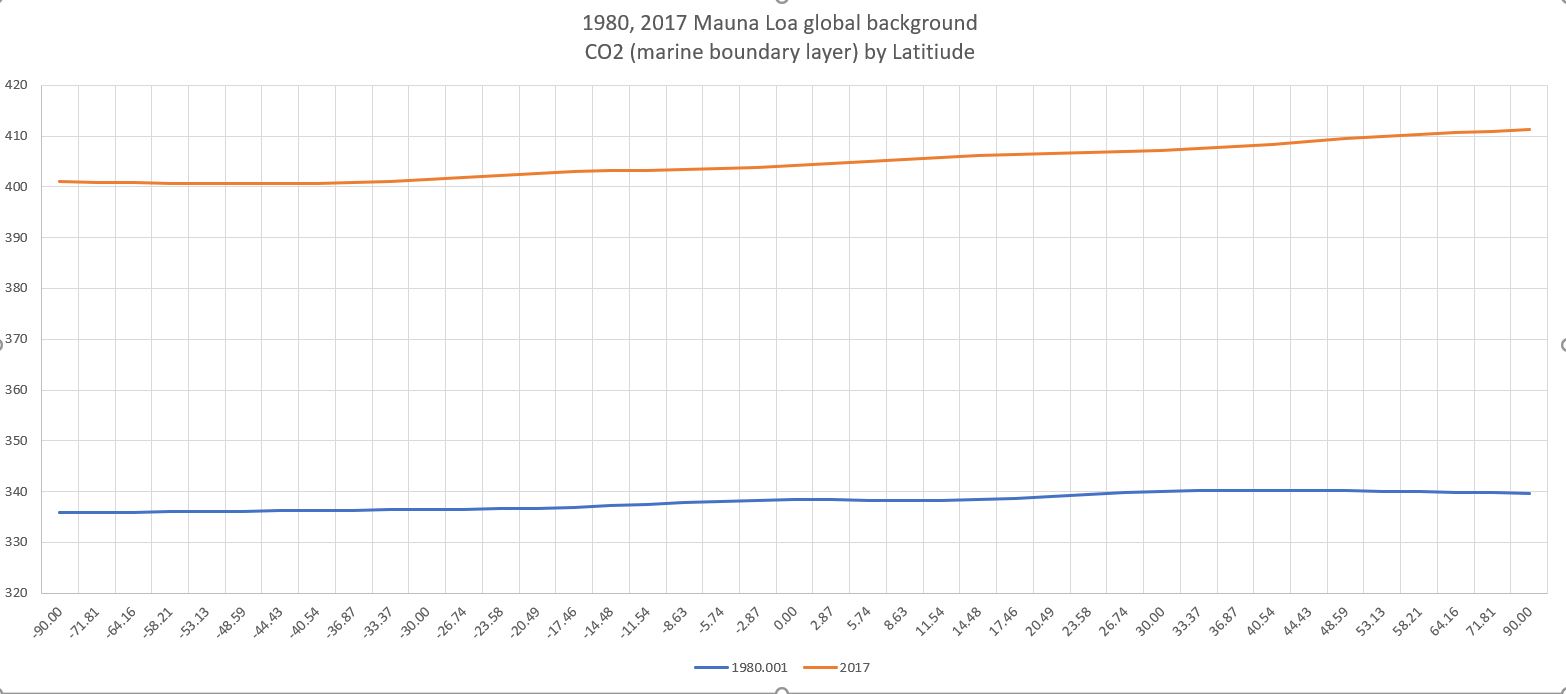
CO2 minimum 401 ppm. Maximum 410 ppm.
Very little signature to temperature. The rise of carbon dioxide by latitude is only 2.5%. This data is courtesy of Dr Pieter Tans of NOAA Mauna Loa and Dave White of Climate Change Truth who made the graph. Antarctic sea ice has been growing for years. More proof the warming we have is astrophysical. More proof Antarctica sea ice is growing.
The correct Greenhouse effect of Carbon dioxide is 0.08 C. Greenhouse effect
I went to a small conference on 9/19/2017 7 pm at the Portland Oregon Airport Sheraton Hotel. This was sponsored by the John Birch Society. They brought in a 30 year veteran reporter of all things United Nations. In the PowerPoint presentation he showed us many things the U.N. would not want anyone to know. Including a page from a 1980’s manuscript that showed The U.N. knew some astrophysical happened in the 1970’s to cause warming mostly in the northern hemisphere and decided to call it global warming as an experiment to control people. Global warming, climate Change and Agenda 21 are all from a deceitful United nations and about social engineering.
Here is a paper from Stanford University. Early Earth stayed warm because its ocean absorbed more sunlight; greenhouse gases were not involved, Stanford researchers say:
https://news.stanford.edu/news/2010/april/early-sun-research-040610.html
