Cap and Trade is a lie! Our NSF Grant request: NSF Proposal On Wednesday November 6th our proposal started peer review at the National Science Foundation. This process takes 6 weeks and then we find out how many scientists give it high marks. If enough then it will go to the director for approval and then funding. Any scientist with freshman college chemistry will know it is correct and give it high marks. On Tuesday November 5th Dr. Hal Doiran and Tom Wysmuller talked about our proposal at 54 minutes. https://www.thespaceshow.com/show/05-nov-2019/broadcast-3407-dr.-hal-doiron-and-tom-wysmuller
The IPCC GWP (Global Warming Potential) calculation is not based on reality. It assumes equal greenhouse gas concentration which will never happen in reality. This is clearly wrong and false.
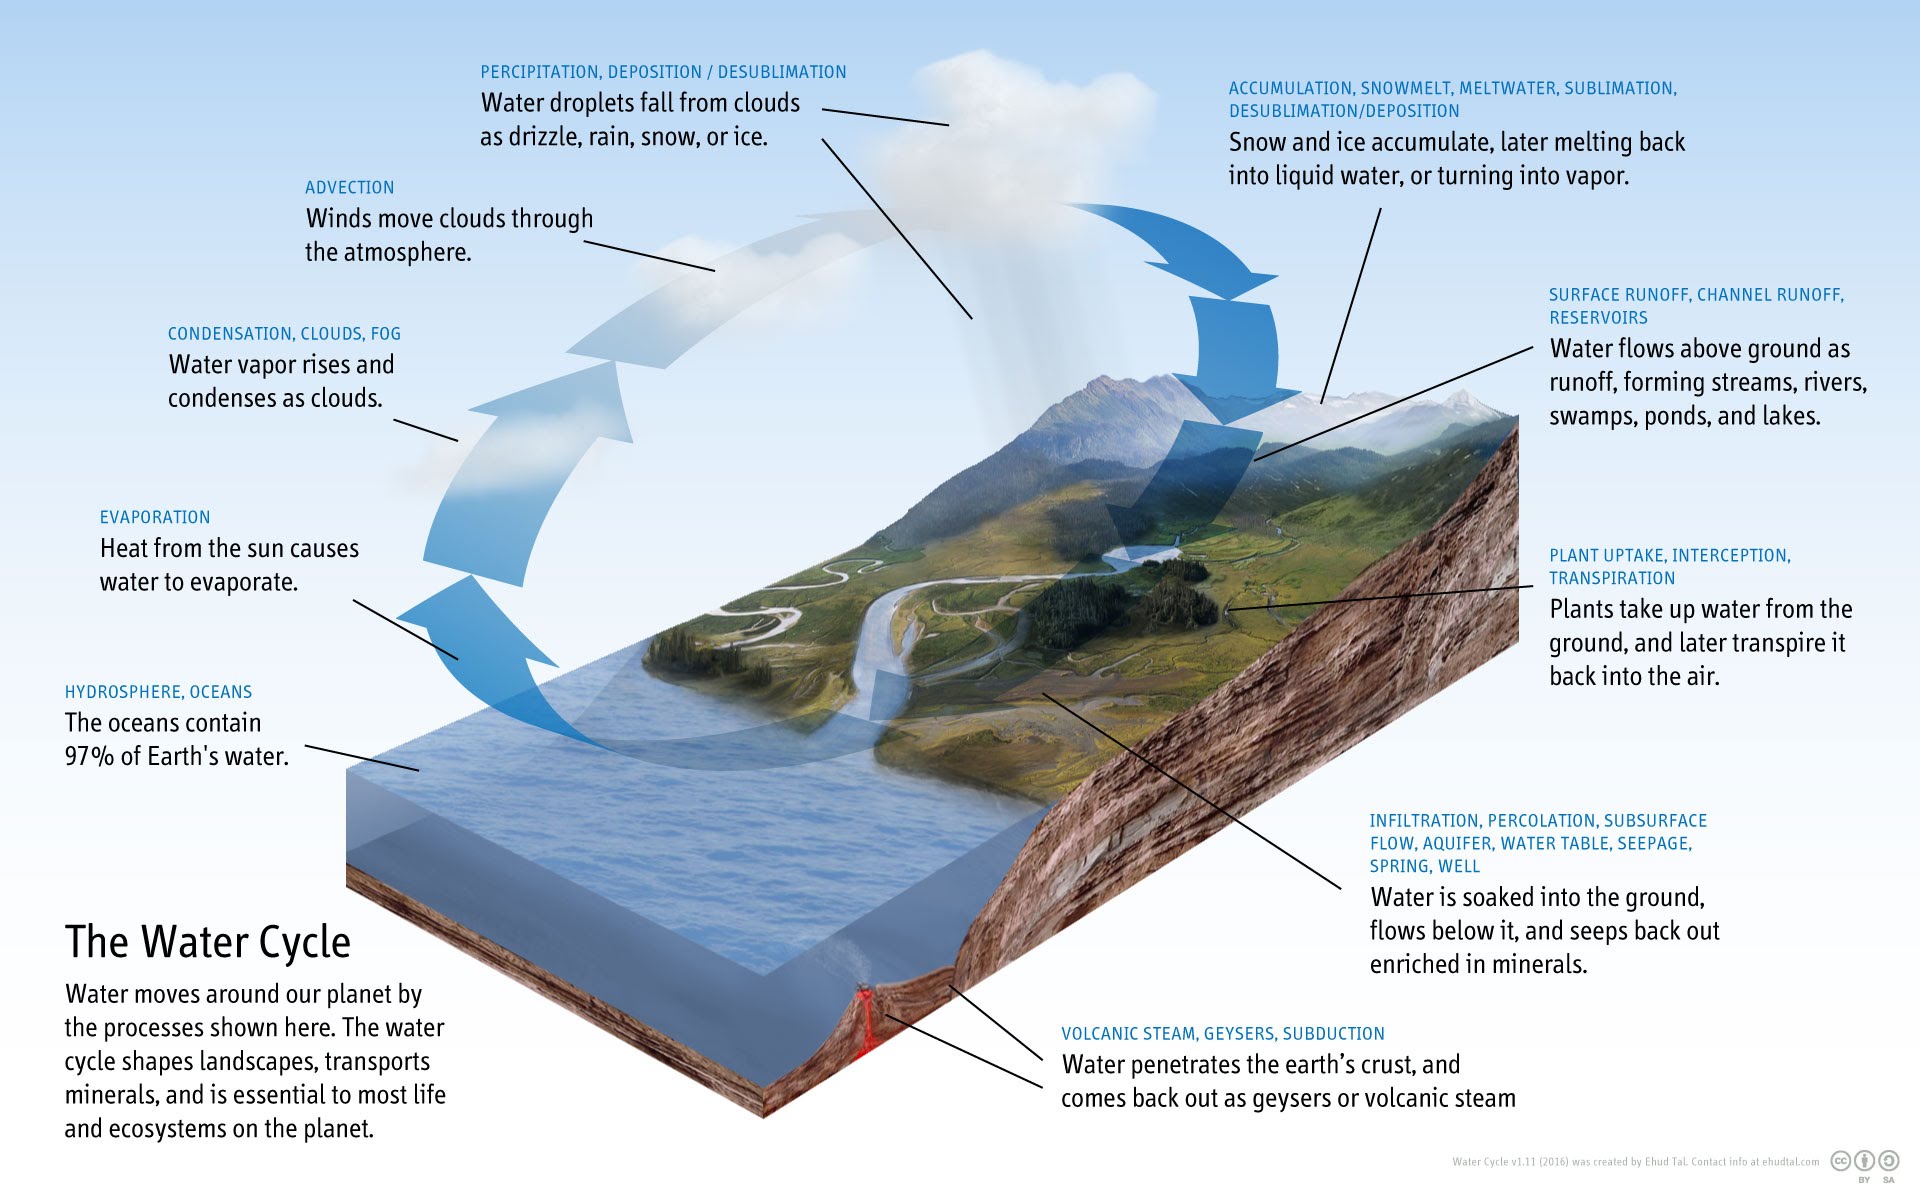
Water vapor is 0.4% to 4% concentration in the Troposphere. Carbon dioxide is 0.04 % concentration. “On one hand, it is the reservoir of precipitations that provide economic drinking water and water supplies for agricultural, industrial, and recreational purposes. On the other hand, it is a natural and the most important greenhouse gas in modern air that raises the temperature of surface air by over 30 K so that the Earth’s surface is habitable for humans and animals.”
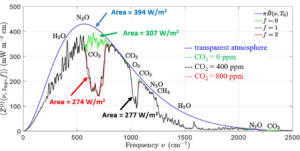
Thermal radiation to space from the Earth, with a surface temperature of 15.5 C and with greenhouse gases is the area under the jagged black “Schwarzschild” curve. This is only about 70% of what it would be without greenhouse gases, the area under the smooth blue “Planck” curve. The Sun heats the Earth and greenhouse gases hinder the cooling.
H2O water vapor is the 89% effect greenhouse gas followed by CO2 carbon dioxide is 8.9% greenhouse effect and methane CH4 is 0.3% effective Greenhouse Gas.
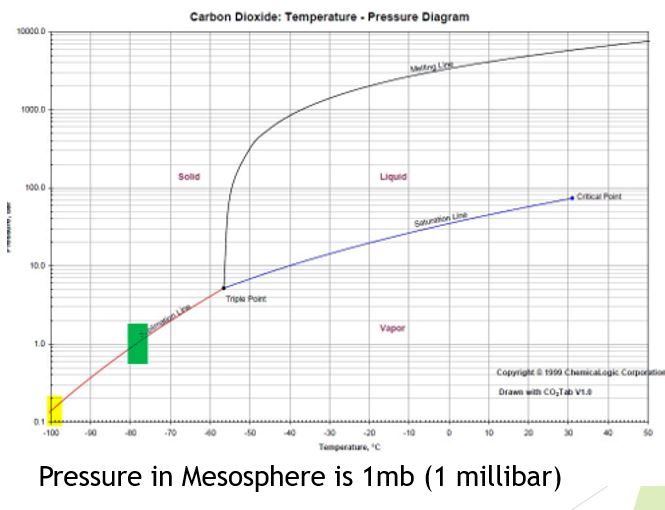
Dr. T. J. Biasing of Oak Ridge National Laboratory exposed greenhouse gasses to long wave radiation. This long wave radiation is said to be the cause of global warming. Not freezing of CO2 in the Mesosphere. (This freezing is an Al Gore lie! The freezing point of CO2 at the pressure in the Mesosphere is -100 C, The temperature in the Mesosphere is -90 C)
Gas Increased radiative forcing (Watts/m2)
CO2 concentration is in ppm. (parts per million) 1.94
CH4 Methane concentration is in ppb. (parts per billion) 0.50
Other greenhouse gases are even less effect and are called negligible in science.
The data is here: Now transitioning to a new drive at DOE. https://data.ess-dive.lbl.gov/view/doi:10.3334/CDIAC/ATG.032
Soon the DEQ will require all businesses to go to the fake EPA carbon footprint calculator and put in their total natural gas and electric costs for 1 year. Then it will calculate the carbon dioxide amount. The DEQ will give this information to the state revenue department to charge each business a carbon tax. However the IPCC global Warming Potential model is fake. It was published with loose references in Nature Climate Change when their Chief Editor had a PhD in political science. In our 30 Scientific PhD’s review of Working Group One of the IPCC for the National Academy of Science we found this model was not benchmarked with available data. In Annex (appendix) II we found 14 published manuscripts with correct order of greenhouse gases.
We submitted our review thirty separate times. For the next version of the WG1 report they deleted the table in Annex two. This is how corrupt the IPCC is. The data in the annex two table was from 14 published manuscripts and the same order as the measurement of Oak Ridge Lab. This is in the Greenhouse gas page of cctruth.org
Table 7.2 page 3 of http://irina.eas.gatech.edu/EAS8803_SPRING2012/Lec7.pdf
Calculating percent effect is for water vapor 303.8/344.2*100=88.26%
The 339.8 is the sum of these effects.
Water vapor is 89.4% ghg effect.
Carbon dioxide is 9.09%
Ozone is 0.88%
Nitrous Oxide is 0.32%
Methane is 0.29%
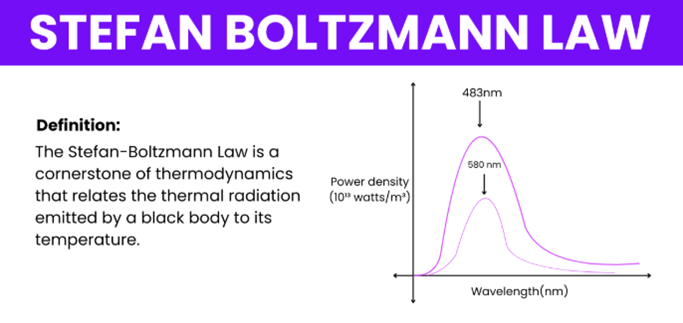
Stefan–Boltzmann Law
Radiation heat transfer rate, q [W/m2], from a body (e.g. a black body) to its surroundings is proportional to the fourth power of the absolute temperature and can be expressed by the following equation:
q = εσT4
where σ is a fundamental physical constant called the Stefan–Boltzmann constant, which is equal to 5.6697×10⁻⁸ W/m2K4. The Stefan–Boltzmann constant is named after Josef Stefan (who discovered the Stefa-Boltzman law experimentally in 1879) and Ludwig Boltzmann (who derived it theoretically soon after). As can be seen, radiation heat transfer is important at very high temperatures and in a vacuum. The atmosphere drains to a vacuum of space.